
Average Grip Strength by Age and Sex: Charts, Norms, and What Yours Means

Grip strength is one of the few fitness markers with decades of population data behind it. That means you can measure yours in about ten seconds and compare it to published reference values rather than guessing. Below are norms by age and sex from a national survey, the standard test protocol, and an honest read of what the grip and longevity research does and does not show.
Quick answer: what is average grip strength?
In the Canadian Health Measures Survey, one of the larger nationally representative datasets on this, mean maximum grip strength across ages 6 to 79 was 42.8 kg (about 94 lb) for males and 26.2 kg (about 58 lb) for females. Narrowing to prime adult years, the mean for ages 20 to 39 was 48.5 kg for men and 28.4 kg for women.
Pooled British data tells a similar story. In Dodds and colleagues' 2014 analysis of twelve British studies published in PLOS ONE, grip peaked at a mean of 51.9 kg in males and 31.4 kg in females, both around age 32. In the United States, Wang and colleagues' 2018 normative study in the Journal of Orthopaedic and Sports Physical Therapy, drawn from the NIH Toolbox project, reported a high of 49.7 kg for the dominant hand of men aged 25 to 29.
So a reasonable working answer: roughly 45 to 52 kg for adult men in their twenties and thirties, and roughly 26 to 31 kg for adult women in the same range, depending on which dataset and which protocol you use.
Grip strength chart: norms by age and sex
The table below is taken directly from Statistics Canada's grip strength reference values (Wong, Health Reports, 2016), based on the 2007 to 2013 Canadian Health Measures Survey. Values are maximum grip strength in kilograms, meaning the best reading from either hand. The 50th percentile column is the median, or what most people mean by average. The 25th and 75th columns give you the middle half of the population.
| Age | Male 25th | Male 50th | Male 75th | Female 25th | Female 50th | Female 75th |
|---|---|---|---|---|---|---|
| 20 to 24 | 38.2 | 42.9 | 47.7 | 23.7 | 26.6 | 29.4 |
| 25 to 29 | 40.5 | 45.2 | 49.9 | 24.6 | 27.5 | 30.3 |
| 30 to 34 | 42.1 | 46.9 | 51.5 | 25.2 | 28.1 | 31.0 |
| 35 to 39 | 43.2 | 47.9 | 52.5 | 25.5 | 28.4 | 31.3 |
| 40 to 44 | 43.6 | 48.4 | 52.9 | 25.6 | 28.5 | 31.4 |
| 45 to 49 | 43.4 | 48.1 | 52.6 | 25.4 | 28.3 | 31.1 |
| 50 to 54 | 42.5 | 47.3 | 51.7 | 25.0 | 27.8 | 30.5 |
| 55 to 59 | 41.1 | 45.9 | 50.1 | 24.2 | 27.0 | 29.7 |
| 60 to 64 | 39.0 | 43.8 | 48.0 | 23.3 | 25.9 | 28.5 |
| 65 to 69 | 36.3 | 41.1 | 45.2 | 22.0 | 24.6 | 27.1 |
| 70 to 74 | 33.0 | 37.7 | 41.8 | 20.5 | 23.0 | 25.3 |
| 75 to 79 | 29.1 | 33.7 | 37.8 | 18.7 | 21.1 | 23.3 |
Source: Statistics Canada, Health Reports, "Grip strength reference values for Canadians aged 6 to 79," 2016, based on the Canadian Health Measures Survey. Values are in kilograms. Multiply by 2.205 for pounds.
One caveat worth stating plainly: these numbers are protocol specific. The Canadian survey used a Smedley dynamometer with the participant standing and the arm extended. Many clinical norms, including the widely used Mathiowetz reference values, use a Jamar dynamometer with the participant seated and the elbow at 90 degrees. Standing generally produces higher readings than seated. Compare your score to norms collected the same way you tested, and do not read too much into a 2 or 3 kg difference between charts.
How to test your grip strength
The standard method is a hand dynamometer. The American Society of Hand Therapists protocol, which most clinical norms follow, looks like this:
- Sit upright, feet flat, shoulder neutral and not abducted.
- Elbow bent to 90 degrees, forearm neutral, wrist between 0 and 30 degrees of extension.
- Set the handle to the second grip position for most adults, and keep that setting for every retest.
- Squeeze maximally for about three to five seconds. Exhale. Do not swing the arm or brace the device against your body.
- Take three trials per hand with about 60 seconds of rest between, and record either the best trial or the mean of three. Be consistent about which one you use.
Retest under the same conditions: same device, same position, same time of day, and not immediately after a heavy pulling session.
Once you have a reading, our free grip strength calculator converts it into your estimated percentile for your age and sex using the same reference data as the chart above.
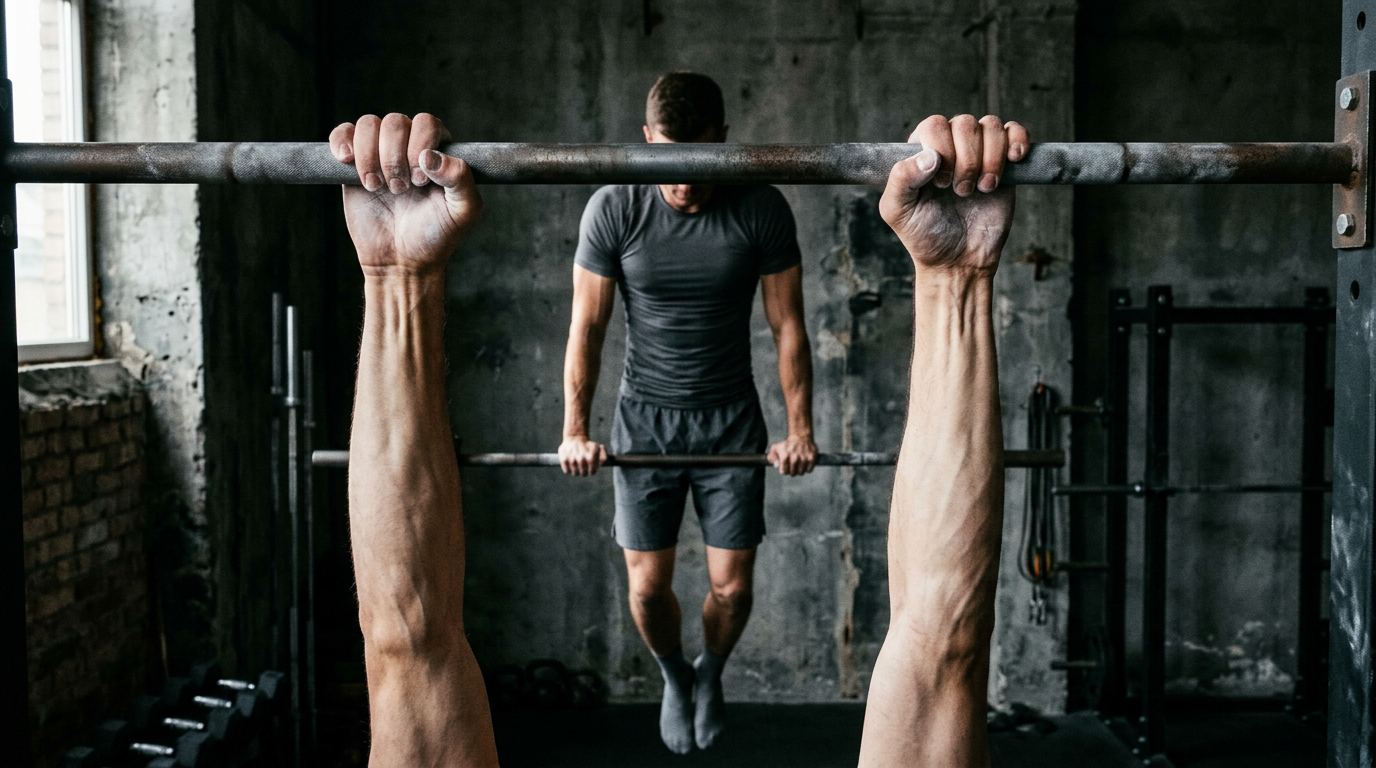
If you do not own a dynamometer, two gym tests track the same quality closely enough to be useful, though neither has published population norms the way dynamometry does. The first is a timed dead hang from a straight bar with a double overhand grip, no straps. The second is a farmers carry for time or distance at a fixed load. Both are repeatable and both give you a number to beat. Treat them as training benchmarks rather than clinical measurements.
What the grip strength and longevity research actually says
The headline study is the Prospective Urban Rural Epidemiology (PURE) study, published by Leong and colleagues in The Lancet in 2015. It followed roughly 140,000 adults across 17 countries. Every 5 kg lower grip strength was associated with a 16 percent higher risk of death from any cause (hazard ratio 1.16, 95 percent confidence interval 1.13 to 1.20). In that cohort, grip strength was a stronger predictor of all-cause and cardiovascular mortality than systolic blood pressure.
That is a genuinely striking finding, and it is also an association, not a demonstration of cause. Nobody has shown that training your grip up by 5 kg lowers your mortality risk by 16 percent. The most defensible interpretation is that grip is a cheap, reliable proxy for total muscle strength, nutritional status, and overall physiological reserve, and those things travel with health outcomes. Weak grip is a signal worth noticing, not a diagnosis.
Clinically, the threshold most used today comes from the European Working Group on Sarcopenia in Older People (EWGSOP2), which flags low muscle strength below 27 kg in men and 16 kg in women. Those cutoffs were derived from the same pooled British dataset behind the Dodds normative curves. They are screening triggers for further assessment in older adults, not fitness targets, and interpreting them is a job for a clinician rather than a chart on the internet.
How to improve grip if you are below average
Grip responds quickly to direct work because most people have never trained it deliberately. The short version: add loaded carries, hang from a bar without straps, and do some dedicated crush and support work two or three times a week. We break the programming down properly in our guide to grip strength exercises and how to build a crushing grip, so there is no point duplicating it here.

Battle Bands
10 to 125 lb resistance bands for wrist, forearm, and crush work anywhere. $39.
Shop now →Frequently asked questions
What is a good grip strength?
A practical definition of good is at or above the 75th percentile for your age and sex. Using the Canadian reference values above, that is roughly 52 kg for a man in his thirties or forties and roughly 31 kg for a woman in the same range. Anything at or above the median puts you in the stronger half of the population.
Does grip strength predict longevity?
It is consistently associated with mortality risk in large cohort studies. The PURE study found a 16 percent higher risk of all-cause death per 5 kg of lower grip strength. That association is real and it replicates, but it does not establish that grip training extends life. Grip is best understood as a marker of general strength and physiological reserve rather than a lever you pull directly.
How do I test grip without a dynamometer?
Use a timed dead hang from a bar with a double overhand grip and no straps, and a farmers carry at a fixed load for time or distance. Neither maps onto published kilogram norms, so you cannot use them to place yourself on the chart above. What they do well is track your own progress over weeks and months.
Is 100 lbs of grip strength good?
One hundred pounds is about 45.4 kg. For a man aged 20 to 24, that sits above the median of 42.9 kg in the Canadian reference data. For a man aged 30 to 44, it sits a little below the median of roughly 47 to 48 kg, around the 25th to 50th percentile. For a woman at any adult age in that dataset, 45.4 kg is above the 95th percentile. So the answer depends entirely on who is squeezing.
Related reading
- Grip Strength Calculator: Your Percentile by Age and Sex
- Grip Strength Exercises: How to Build a Crushing Grip
- Dead Hang Benefits: How Long You Should Hang and How to Progress
- Farmers Carry: Benefits, Form, and Workouts
- Military PT Calculators
This article is for general information and fitness context only. It is not medical advice. Normative values differ between studies, populations, and dynamometer models, and a single reading should not be used to assess your health. Talk to a clinician about any concerns.